Analysis:
CENTRE:
I notice that the median weight of the sample is slightly higher/significantly
higher /similar than the back sample median.
This means that there is only a small/huge/no difference between the median
weight for this sample.
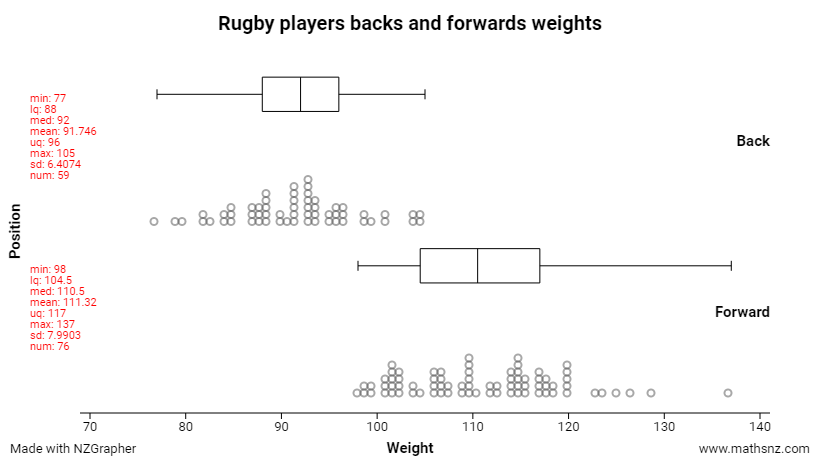
The median weight for the forward is 110.5 which is only 18.5 higher than the
back weight median of 92.
(2) SPREAD:
IQR (Interquartile range)= upper quartile - lower quartile
IQR of Male- IQR Female-
I notice that the middle 50% of the weight for each of the sample distributions
have a slightly higher/significantly higher /similar spread.
This means that there is only a small/huge/no difference between the median
weight for this sample.
The IQR for the forward sample is 12.5 kg and the IQR for the back sample is 8 kg.
.
(3) SHIFT/OVERLAP:
I notice that there is significant/slightly/ does not overlap between the forward
and back middle 50% of weight in this sample distribution. The LQ, median, UQ of the
forward sample is only slightly higher than the back sample.
This indicates that there is not much/ huge difference between the median of the
forward and back students in this sample.
The forward sample LQ has shifted 104.5 kg up the scale, the median has shifted up
the scale and the UQ has shifted 18.5 up the scale.
1 comment:
Great work Lara!!
Post a Comment